


Collecting GPU metrics with Grafana
It is important to note that this setup isn’t secure. We highly recommend reading the documentation for each component used independently and utilizing the built-in security features whenever possible.
In this guide, we will demonstrate how to monitor each GPU on your server and create beautiful dashboards using Grafana. All metrics will be collected using the Prometheus exporter. The exporter will periodically call the nvidia-smi binary to read all available values every few seconds.
Install Grafana
To ensure a smooth installation process, it is recommended to install Grafana from the project’s official repository. Before you add the repository to a package manager’s sources list, please verify that all the required packages are presented in the operating system. The following command installs aby missing ones:
sudo apt -y install apt-transport-https software-properties-common wget
Let’s create a separate directory for keyrings:
sudo mkdir -p /etc/apt/keyrings/Download and apply the Grafana GPG key:
wget -q -O - https://apt.grafana.com/gpg.key | gpg --dearmor | sudo tee /etc/apt/keyrings/grafana.gpg > /dev/nullAdd the Grafana repository using the downloaded key:
echo "deb [signed-by=/etc/apt/keyrings/grafana.gpg] https://apt.grafana.com stable main" | sudo tee -a /etc/apt/sources.list.d/grafana.listUpdate cache and install Grafana:
sudo apt update && sudo apt -y install grafanaAfter the process finishes, you can start the application:
sudo systemctl start grafana-server.serviceIf you want to run Grafana alongside the operating system:
sudo systemctl enable grafana-server.serviceInstall Prometheus
To determine the current version and access the package download link, you should visit the project’s official website. For example, if you need to install Prometheus v2.47.1, you can use the following link:
wget https://github.com/prometheus/prometheus/releases/download/v2.47.1/prometheus-2.47.1.linux-amd64.tar.gzUnpack the archive:
tar xvfz prometheus-2.47.1.linux-amd64.tar.gzOpen the unpacked directory:
cd prometheus-2.47.1.linux-amd64Let’s copy two executable files to the system directory:
sudo cp prometheus /usr/local/binsudo cp promtool /usr/local/binCreate a separate directory for the configuration files:
sudo mkdir /etc/prometheusAnd copy these files to it:
sudo cp -r consoles /etc/prometheussudo cp -r console_libraries /etc/prometheusCreate a configuration file named prometheus.yml, which will contain the main Prometheus settings and targets:
sudo nano /etc/prometheus/prometheus.ymlglobal:
scrape_interval: 15s
scrape_configs:
- job_name: 'prometheus'
scrape_interval: 5s
static_configs:
- targets: ['localhost:9090']
- job_name: 'nvidia'
scrape_interval: 5s
static_configs:
- targets: ['localhost:9835']There are basic options and two targets:
- localhost:9090 - this target is a built-in Prometheus target by default.
- localhost:9835 - this will be used to scrape metrics from nvidia_smi_exporter.
Press Ctrl + X, then Y, then Enter to save the file and exit the text editor. It’s a good idea to run Prometheus as a dedicated user, without shell access. We suggest creating a user like this:
sudo useradd --no-create-home --shell /bin/false prometheusGood. Executable files have been copied, and configuration files are in their places. It’s time to inform the operating system that Prometheus can be used as a daemon and managed with systemd. Execute the following command and input this content:
sudo systemctl edit --full --force prometheus.service[Unit]
Description=Prometheus
Wants=network-online.target
After=network-online.target
[Service]
User=prometheus
Group=prometheus
Type=simple
ExecStart=/usr/local/bin/prometheus \
--config.file=/etc/prometheus/prometheus.yml \
--storage.tsdb.path=/var/lib/prometheus/ \
--web.console.templates=/etc/prometheus/consoles \
--web.console.libraries=/etc/prometheus/console_libraries
[Install]
WantedBy=multi-user.targetSave and exit by pressing Ctrl + X, then Y, then Enter. Next, you need to make the newly created user the owner of two working directories and their content:
sudo chown -R prometheus:prometheus /etc/prometheussudo chown -R prometheus:prometheus /var/lib/prometheusEverything is ready to start Prometheus. Run the daemon:
sudo systemctl start prometheusCheck the status and you’ll get a result like this:
sudo systemctl status prometheus● prometheus.service - Prometheus
Loaded: loaded (/etc/systemd/system/prometheus.service; enabled; vendor preset: enabled)
Active: active (running) since Mon 2023-10-09 12:44:16 UTC; 5min ago
Main PID: 2223 (prometheus)
Tasks: 42 (limit: 425060)
Memory: 96.4M
CPU: 1.099s
CGroup: /system.slice/prometheus.service
└─2223 /usr/local/bin/prometheus --config.file=/etc/prometheus/prometheus.yml ->
Oct 09 12:44:19 gpuserver prometheus[2223]: ts=2023-10-09T12:44:19.263Z caller=head.go:760 l>
Oct 09 12:44:19 gpuserver prometheus[2223]: ts=2023-10-09T12:44:19.269Z caller=head.go:760 l>
Oct 09 12:44:19 gpuserver prometheus[2223]: ts=2023-10-09T12:44:19.269Z caller=head.go:760 l>
Oct 09 12:44:19 gpuserver prometheus[2223]: ts=2023-10-09T12:44:19.270Z caller=head.go:797 l>
Oct 09 12:44:19 gpuserver prometheus[2223]: ts=2023-10-09T12:44:19.273Z caller=main.go:1045 >
Oct 09 12:44:19 gpuserver prometheus[2223]: ts=2023-10-09T12:44:19.273Z caller=main.go:1048 >
Oct 09 12:44:19 gpuserver prometheus[2223]: ts=2023-10-09T12:44:19.273Z caller=main.go:1229 >
Oct 09 12:44:19 gpuserver prometheus[2223]: ts=2023-10-09T12:44:19.274Z caller=main.go:1266 >
Oct 09 12:44:19 gpuserver prometheus[2223]: ts=2023-10-09T12:44:19.274Z caller=main.go:1009 >
Oct 09 12:44:19 gpuserver prometheus[2223]: ts=2023-10-09T12:44:19.274Z caller=manager.go:10>
The last command will indicate that the Prometheus daemon should be loaded automatically when the operating system starts:
sudo systemctl enable prometheusScraping metrics in Linux
All the previous steps were merely preparation. Even though Grafana and Prometheus have already been installed, they know nothing about each other. Let's add a new data source to Grafana. Open your web browser and type the following address:
http://[LEADERGPU_IP_ADDRESS]:3000/connections/datasources/newFor the first login to Grafana, use the default credentials: admin/admin. These need to be changed immediately afterward. On the opened page, choose Prometheus:

Set the name and URL of our local Prometheus instance. By default, it operates on port 9090 and uses the simple HTTP protocol:

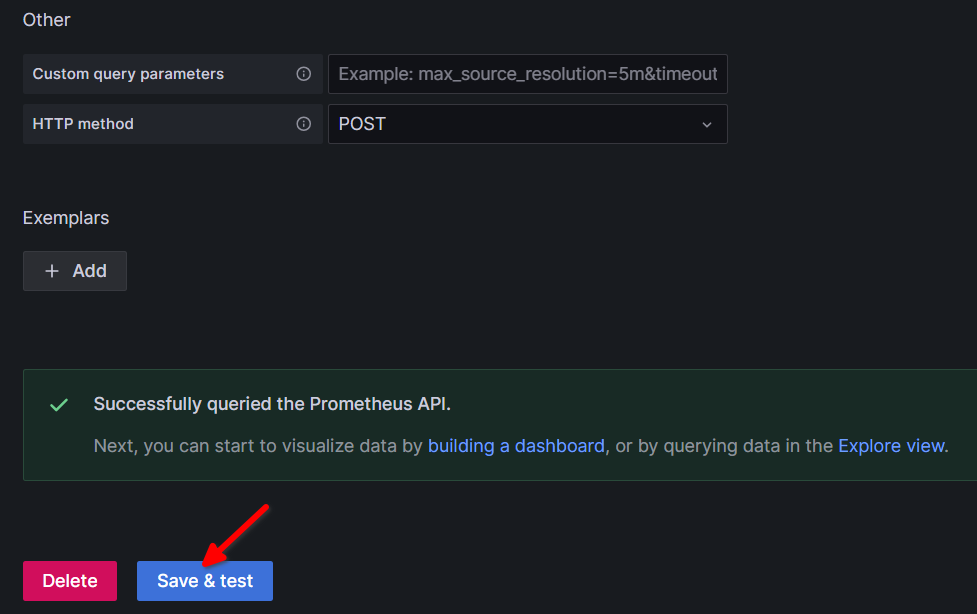
Scroll down to the end and click on the Save & test button. Grafana will send a short request to Prometheus and if everything is OK, you’ll receive a message like this:
Now, you need a ready-made official dashboard working with the nvidia_gpu_metrics exporter. Open the following link in your browser:
https://grafana.com/grafana/dashboards/14574-nvidia-gpu-metrics/Here you have the Download JSON button. You don’t actually need to download a JSON file. Simply right-click on it and select Copy link address:

Open the Grafana web interface at http://[LEADERGPU_IP_ADDRESS]:3000/, then click on the plus symbol and select the Import dashboard menu item:

Insert the copied link to the following field by pressing the Ctrl + V keyboard shortcut, then click on the Load button:

Grafana will download the dashboard, and you’ll need to select the previously created data source, Prometheus, from the drop-down menu. Then, click the Import button:

A nice dashboard will open, but it doesn’t show any data yet:

This is because we haven’t yet installed the final component: the nvidia_gpu_exporter. Let’s do that. Open link in your web browser and copy the link to the deb-package. You can now download it using the wget utility:
wget https://github.com/utkuozdemir/nvidia_gpu_exporter/releases/download/v1.2.0/nvidia-gpu-exporter_1.2.0_linux_amd64.debFinally, install it:
sudo dpkg -i nvidia-gpu-exporter_1.2.0_linux_amd64.debWait a few seconds and you’ll receive the first data on your Grafana dashboard:

Enjoy your new monitoring tool!
Scraping metrics in Windows Server
The system described above doesn’t need to be located on the same server. For instance, you can establish a combination of Grafana and Prometheus on one server (even a small single-board computer like Raspberry Pi will suffice) and scrape GPU metrics from a remote server. The key component of the system, nvidia_gpu_exporter, can operate not only on Linux but also on Windows Server. We have prepared brief instructions for its installation.
Open PowerShell and run the following commands sequentially. Allow the current user to run PowerShell scripts:
Set-ExecutionPolicy RemoteSigned -Scope CurrentUserGet and install the Scoop package manager:
iex "& {$(irm get.scoop.sh)} -RunAsAdmin"Install the nssm and git packages using Scoop. These packages are necessary to obtain nvidia_gpu_exporter from Github and install it as a system service:
scoop install nssm --globalscoop install gitScoop manages apps by grouping them into collections, which are called buckets. Let’s create one with necessary app:
scoop bucket add nvidia_gpu_exporter https://github.com/utkuozdemir/scoop_nvidia_gpu_exporter.gitNow, we are ready to download and install the app:
scoop install nvidia_gpu_exporter/nvidia_gpu_exporter --globalWhen the app starts, it uses port number 9835. You need to configure Windows Defender Firewall to accept connections from outside:
New-NetFirewallRule -DisplayName "Nvidia GPU Exporter" -Direction Inbound -Action Allow -Protocol TCP -LocalPort 9835Tell the operating system that nvidia_gpu_exporter is a new service and it needs to run while operating system loads:
nssm install nvidia_gpu_exporter "C:\ProgramData\scoop\apps\nvidia_gpu_exporter\current\nvidia_gpu_exporter.exe"The final step is to run the service:
Start-Service nvidia_gpu_exporterPlease note that you need to add the remote server as target in your prometheus.yml:
…
  - job_name: 'nvidia'
    scrape_interval: 5s
    static_configs:
    - targets: ['REMOTE_SERVER_IP:9835']
…
See also:
Updated: 04.01.2026
Published: 25.06.2024